As technology has evolved over the years, storing information has become instantaneous, autonomous, and pretty much hassle-free. Making sense of it is an entirely different story.
A running business generally has multiple projects or orders that are taking place on any given day. This also means an inflow of data of various forms from multiple sources. As technology has evolved over the years, storing information has become instantaneous, autonomous, and pretty much hassle-free. Making sense of it is an entirely different story.
Sifting through data, one can find what one’s looking for after spending a great deal of time connecting the dots manually. A company, for example, that has fulfilled a hundred orders wanting to know how its entire field crew has performed, as well as individual performance reports on each crewmember based on various performance metrics, will probably end up spending a lot of time getting all of this done manually and still end up with numbers to compare side-by-side.
This time will not just be wasted on the managerial level but also the executive level with a chance of confusion due to so much raw data, which can be bad for decision-making. Improper processing of data leads to an unclear picture, which leads to errors in company decisions and ultimately results in completely avoidable losses. That is where dashboards come in.

Dashboards take large amounts of data and show it in visual representations like charts and graphs that can be deciphered with ease and instantly. The time and effort saved from collecting the data can then be used to interpret data and make appropriate strategies making decision-making effective and efficient with significantly reduced chances of errors.
Here are the top reasons why having a dashboard is absolutely essential:
- It saves time by simplifying complex data into easy to understand visual representations.
- It reduces errors by showing a clear picture of the data.
- It shows all the vital information on one screen.
- You can bring in information from a plethora of software applications.
- It improves decision-making processes.
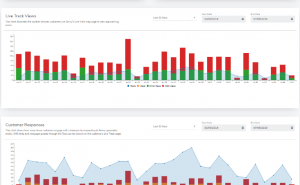
Arrivy’s ‘data and reporting’ feature provides you with a dashboard showing all critical data in one scroll, which has allowed businesses to save up to 30% of operations time. Arrivy understands the importance of data and its role in deciding the direction of a company, which is why it ensures that its clients get all necessary data, which is both easy to access and easy to understand.
-Asfandyar Asad.

Leave a Reply